![]()
Into the Deflationary Vortex
By Paul Lamont
May 30, 2008
We hope you have a chance to read our rebuttal to CNNMoney.com’s recent Great Depression article. While we have described the 1930 peak before (all the way back in October of 2006), we feel our analysis has been vindicated. We may take some flak for getting too far out ahead of the parade back in 2006; but our readers know we discuss long term trends. (Check our chart below on personal savings!) The reasoning in October was correct;
“Higher rates will prevent many from refinancing out of their adjustable rate mortgages. Reports from Fannie Mae state that over $1 trillion dollars in mortgages will reset at higher rates in 2007. Many U.S. homeowners, whose savings rate is negative, will not be able to withstand this financial pressure. As they default, the third wave and credit crunch will begin.”
With the popping of the credit bubble early last year, mortgage losses are now threatening to collapse the fractional reserve banking system. For financial institutions and consumers that are underwater, cash is needed to pay off debt. The U.S. government is assisting the consumer by providing stimulus checks. The Federal Reserve is providing emergency loans to the banking system. They will fail against market forces.
We are entering the ‘third wave down’, the deflationary vortex, where a decline in confidence reduces prices, consumers and investors reduce purchases in expectation of lower prices, less spending and investment weakens the economy, resulting in defaults on debts, causing more losses in the financial system, which reduces credit available, forcing consumers and investors to cut back on more spending, causing further declines in confidence.

Photograph by Jonathan Minard
Bankers are attempting to save themselves by fudging the numbers. According to the FT.com, financiers are lobbying to use ‘historical’ instead of market prices for assets.

Looking at this house in L.A. with historical pricing, a banker could assume its value is worth $1.15M as it was in October 2006, instead of something closer to the current asking price of $659,900. Or in Atlanta, a house could be valued at $700K (sold in August 2004), instead of what it recently sold for: $51,000. As Warren Buffet recently stated, “You've got a lot of leeway in running a bank to not tell the truth for quite a while.” Creative accounting aside, the FDIC or OCC will shut down banks that have unsound banking practices. The vortex will end when confidence has hit rock-bottom. Unfortunately confidence, as measured by the amount of personal debt, is falling from the highest altitude ever recorded.
A Bifurcated Tale
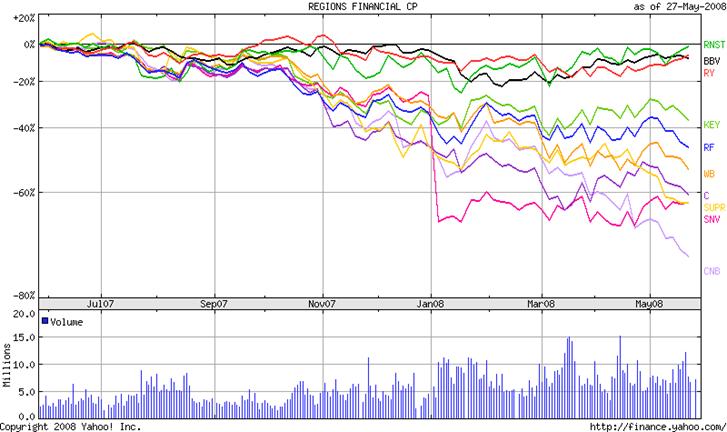
Stock prices are telling us that the next round of troubles will come from the regional banks. With KeyCorp doubling its outlook for bad loans, the credit crunch is moving from Wall Street to Main Street. As we stressed in our CNNMoney.com Rebuttal, “the unavailability of credit and money caused the deflationary spiral of the Great Depression.” MarketWatch reports: “CD’s show signs of stress” as “bank failures to surge in coming years.” After the recent bank failure at Bentonville, AR, the FDIC has provided depositors with bank failure information. We have also provided a comparative stock price chart below to demonstrate the recent bifurcation in the two classes of banks in our area.
Oil Bubble
Besides food, which we mentioned last September, money has also recently rushed into energy. As BusinessWeek states, “many see further gains” in oil despite the fact that “crude has surged 95% in the past year.” When that many folks are so convinced of a continuation of the trend, it’s usually near the end. While bubble tops can have volatile spikes as conclusions, we expect oil prices to register a significant peak. Mr. Soros agrees. So for American drivers, we are forecasting a bit of good news. It’s about time we delivered some good news.
Mega Trends – Mega Thrift
As gas prices have risen, consumers here in Alabama have drastically reduced their consumption. SUV’s and diesel trucks are being replaced by the wife’s Toyota for trips around town. Now that American consumers have been caught in the debt vise of falling assets and rising costs, the new long term trend is reducing consumption/increasing savings. After the Great Depression, the savings rate increased for the next 40 years (chart below).

Chart from The Big Picture
Benjamin Graham On United States Savings Bonds
To understand where we are going with this new thrifty world, we go back to 1949 to Benjamin Graham’s (Warren Buffett’s teacher, ‘The Dean of Wall Street’) description of the United States Savings Bond in The Intelligent Investor;
“Every non-professional investor should have a substantial portion of his funds in these issues; the small investors, who preponderate in terms of numbers, should own as many Series E bonds as they possibly can, even though they buy nothing else. As it happens, the space we shall devote to a discussion of United States Savings Bonds is far less than would be justified by their overshadowing importance. The reason for this, of course, is that investment in these bonds is a simple matter, whereas common-stock investment - constituting the remainder of our total program - is full of possible complexities and dangers.”
The ‘dangers of common stock investing?’ What a change from twenty years earlier! Unfortunately today the last seventy years of inflation have made the purchasing limits of savings bonds prohibitive. So investors are unable to “…own as many as you possibly can, even though they buy nothing else.” Instead, we have opted for the security of the U.S. Treasury Bill. We will have a more detailed comparison of the Treasury Bill and the Savings Bond in next month’s report.
“I like to go for cinches. I like to shoot fish in a barrel. But I like to do it after the water has run out.” – Warren Buffett
Paper Wealth –
It just stays on paper
Stock market investors should listen to their real estate brethren. For instance, Las Vegas real estate agent Donna Marie Gold, who “built a $4.5 million fortune buying and selling properties over six years.” Now she is “$22,000 short each month on payments needed to maintain 14 properties….The whole thing was upside down in a New York minute.” Stock portfolios can also change value very fast. As we described last June, “We have been advising over the last 7 months to sell assets as this credit boom comes to an end. It is always better to get out with cash profits than to have your funds frozen or stuck in bankruptcy. Therefore we continue to recommend to investors to sell assets and hold interest-bearing cash at a secure financial institution.”
How Long Do We Sit In Cash?
How do we know we are correctly positioned? Because most investors cannot stand being in cash. One advisor describes “clients have been ‘kicking and screaming’ about low yields.” They are eager to “pursue riskier investments in search of higher yields.” Contrast this with George Soros’ recent comments: “The days of rapid financial wealth creation are over. We're now in a period of wealth destruction. It is going to be very hard to preserve your wealth in these circumstances.”
“A bear market is a financial cancer that
spreads. Intermediate rallies (occasionally very strong ones) keep the hopes of
investors alive. Furthermore, by continuously publishing bullish reports,
brokers and economists, like good nurses, keep the flame of hope from burning
out. But after 18 to 36 months of
continued losses, total capitulation usually sets in and a major low
occurs.” - Dr. Marc Faber
The Wall Street Broker
Is your current financial advisor conflicted? Are they providing you with wise and independent advice? Is your cash supporting their companies’ balance sheet? Or does its own involvement in the credit meltdown provide an incentive to keep you fully invested? We have elected to stand on the side of the client, with no loyalties to any financial institution. The monkeys can’t make us dance.
At Lamont Trading Advisors, we provide wealth preservation strategies for our clients. For more information, contact us. Our monthly Investment Analysis Report requires a subscription fee of $40 a month. Current subscribers are allowed to freely distribute this report with proper attribution.
***No graph, chart, formula or other device offered can in and of itself be used to make trading decisions. This newsletter should not be construed as personal investment advice. For informational purposes only.
Copyright ©2008 Lamont Trading Advisors, Inc. Paul J. Lamont is President of Lamont Trading Advisors, Inc., a registered investment advisor in the State of Alabama. Persons in states outside of Alabama should be aware that we are relying on de minimis contact rules within their respective home state. For more information about our firm visit www.LTAdvisors.net, or to receive a copy of our disclosure form ADV, please email us at advrequest@ltadvisors.net, or call (256) 850-4161.